

Sea Level Rise Is Already Documented
talkingturkey.substack.com
Sea Level Rise Is Already Documented
Read all about it in a Washington Post article based on its own analysis of tide gauges along our coasts.

An April 29th article on WashingtonPost.com contained this map of sea level rise on the Atlantic and Gulf coasts:
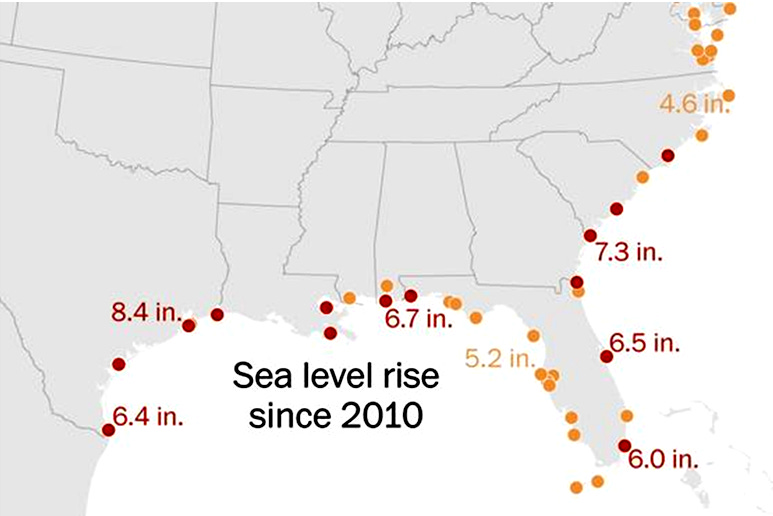
The dark red dots represent 6 to 9 inches of sea level rise, and the orange dots reflect 3 to 6 inches of sea level rise since 2010. The data was from an analysis done by the Washington Post itself.
From the article:
At more than a dozen tide gauges spanning from Texas to North Carolina, sea levels are at least 6 inches higher than they were in 2010 — a change similar to what occurred over the previous five decades.
We have been hearing for years that sea levels would rise due to global warming resulting in the melting of ice on Greenland and Antarctica, but I didn’t realize that so much sea level rise had already occurred.
The rates of sea level rise keep rising as the ice melts fasterr and faster. Every best estimate of how fast it will rise have been too low.
Not to worry! The earth has gone through multiple changes through its long existence, nothing new here. Change is constant.